ICCS Climate Science Nuggets
Preface Material
Acronyms
+:+
Terms
Where possible I have tried to write things for a general audience whilst staying true to terms that may arise in the geosciences.
Listed here are a few definitions for clarity that it may be useful clarify the definitions for:
| Fluid | Anything that flows1. This includes water and air. |
The Coriolis Force
A fictitious force that arises due to existing in a rotating reference frame.
N2L: \[\begin{equation} \vec{F} = m\vec{a} = m \left(\frac{\mathrm{d}^2\vec{r}}{\mathrm{d}t^2}\right) \end{equation}\]
In the rotating frame: \[\begin{equation} \vec{r} = \vec{r_r} + \left(\vec{\Omega}\times\vec{r_r}\right) \end{equation}\]
Such that (for constant \(|\vec{\Omega}|\)): \[\begin{equation} \vec{F} = m \left(\frac{\mathrm{d}^2\vec{r_r}}{\mathrm{d}t^2}\right) - 2m \vec{\Omega}\times\frac{\mathrm{d}\vec{r_r}}{\mathrm{d}t} - m \vec{\Omega}\times(\vec{\Omega}\times\vec{r_r}) \end{equation}\]
The Coriolis Force
\[\begin{align} \vec{F} & = m \left(\frac{\mathrm{d}^2\vec{r_r}}{\mathrm{d}t^2}\right) - 2m \vec{\Omega}\times\frac{\mathrm{d}\vec{r_r}}{\mathrm{d}t} - m \vec{\Omega}\times(\vec{\Omega}\times\vec{r_r}) \\ \vec{F} & = m\vec{a_r} - 2m \vec{\Omega}\times\vec{u_r} - m \vec{\Omega}\times(\vec{\Omega}\times\vec{r_r}) \\ \end{align}\]
The Coriolis Force
MIT demonstration provides the easiest way to view this.

The Coriolis Force
Relevance for geophysical fluid dynamics?
The Earth is a rotating reference frame!
\(\vec{\Omega} = 7.292\times 10^{-5}\) rad/s

As fluids move in the atmosphere and ocean they will experience the Coriolis force. 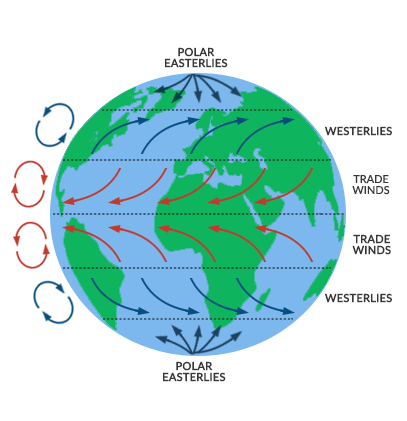
Vorticity
We often think in pressure and velocity. These are tangible variables, but carry a danger of thinking in terms of causality…
Pressure makes fluids move (velocity) but velocity causes pressure changes (Bernoulli and flight)!
Further, velocity conveys information at its speed, whilst pressure is significantly faster (instantaneous or speed of sound).
Vorticity solves this problem for us.

Hunga-Tonga Lamb Wave by Matthew Barlow using NASA GOES images
Curl
Vorticity1 is the local rotation or angular momentum of the fluid.
\[\begin{equation} \vec{\omega} = \nabla \times \vec{u} \,\, , \end{equation}\]
\[\begin{equation} \vec{\omega} = \left[\frac{\partial u_z}{\partial u_y}-\frac{\partial u_y}{\partial u_z} \,\, , \,\, \frac{\partial u_x}{\partial u_z}-\frac{\partial u_z}{\partial u_x} \,\, , \,\, \frac{\partial u_y}{\partial u_x}-\frac{\partial u_x}{\partial u_y}\right] \end{equation}\]

NS equations in terms of vorticity
\[\begin{equation} \frac{\mathrm{D}\vec{u}}{\mathrm{D}t} = -\frac{1}{\rho}\nabla{p} + \nu\nabla^2{\vec{u}} \,\, , \end{equation}\]
\[\begin{equation} \nabla{\bf\cdot}{\vec{u}} = 0 \,\, . \end{equation}\]
Taking the curl of these equations:
\[\begin{equation} \frac{\mathrm{D}\vec{\omega}}{\mathrm{D}t} = \left( \vec{\omega} {\bf\cdot} \nabla \right) \vec{u} + \nu\nabla^2{\vec{\omega}} \end{equation}\]
NS equations in terms of vorticity
\[\begin{equation} \frac{\mathrm{D}\vec{\omega}}{\mathrm{D}t} = \left( \vec{\omega} {\bf\cdot} \nabla \right) \vec{u} + \nu\nabla^2{\vec{\omega}} \,\, . \end{equation}\]
All terms are local to the point under consideration.
- material derivative (advection)
- viscous dissipation
- vortex stretching
Note in-particular, in the absence of viscous forces:
- vorticity is a conserved quantity
- vorticity is ‘frozen-in’ to the fluid (Helmholtz (1858))
Vortex stretching

Plots in terms of Vorticity
Large-scale meteorology is primarily concerned with the vertical component of vorticity.


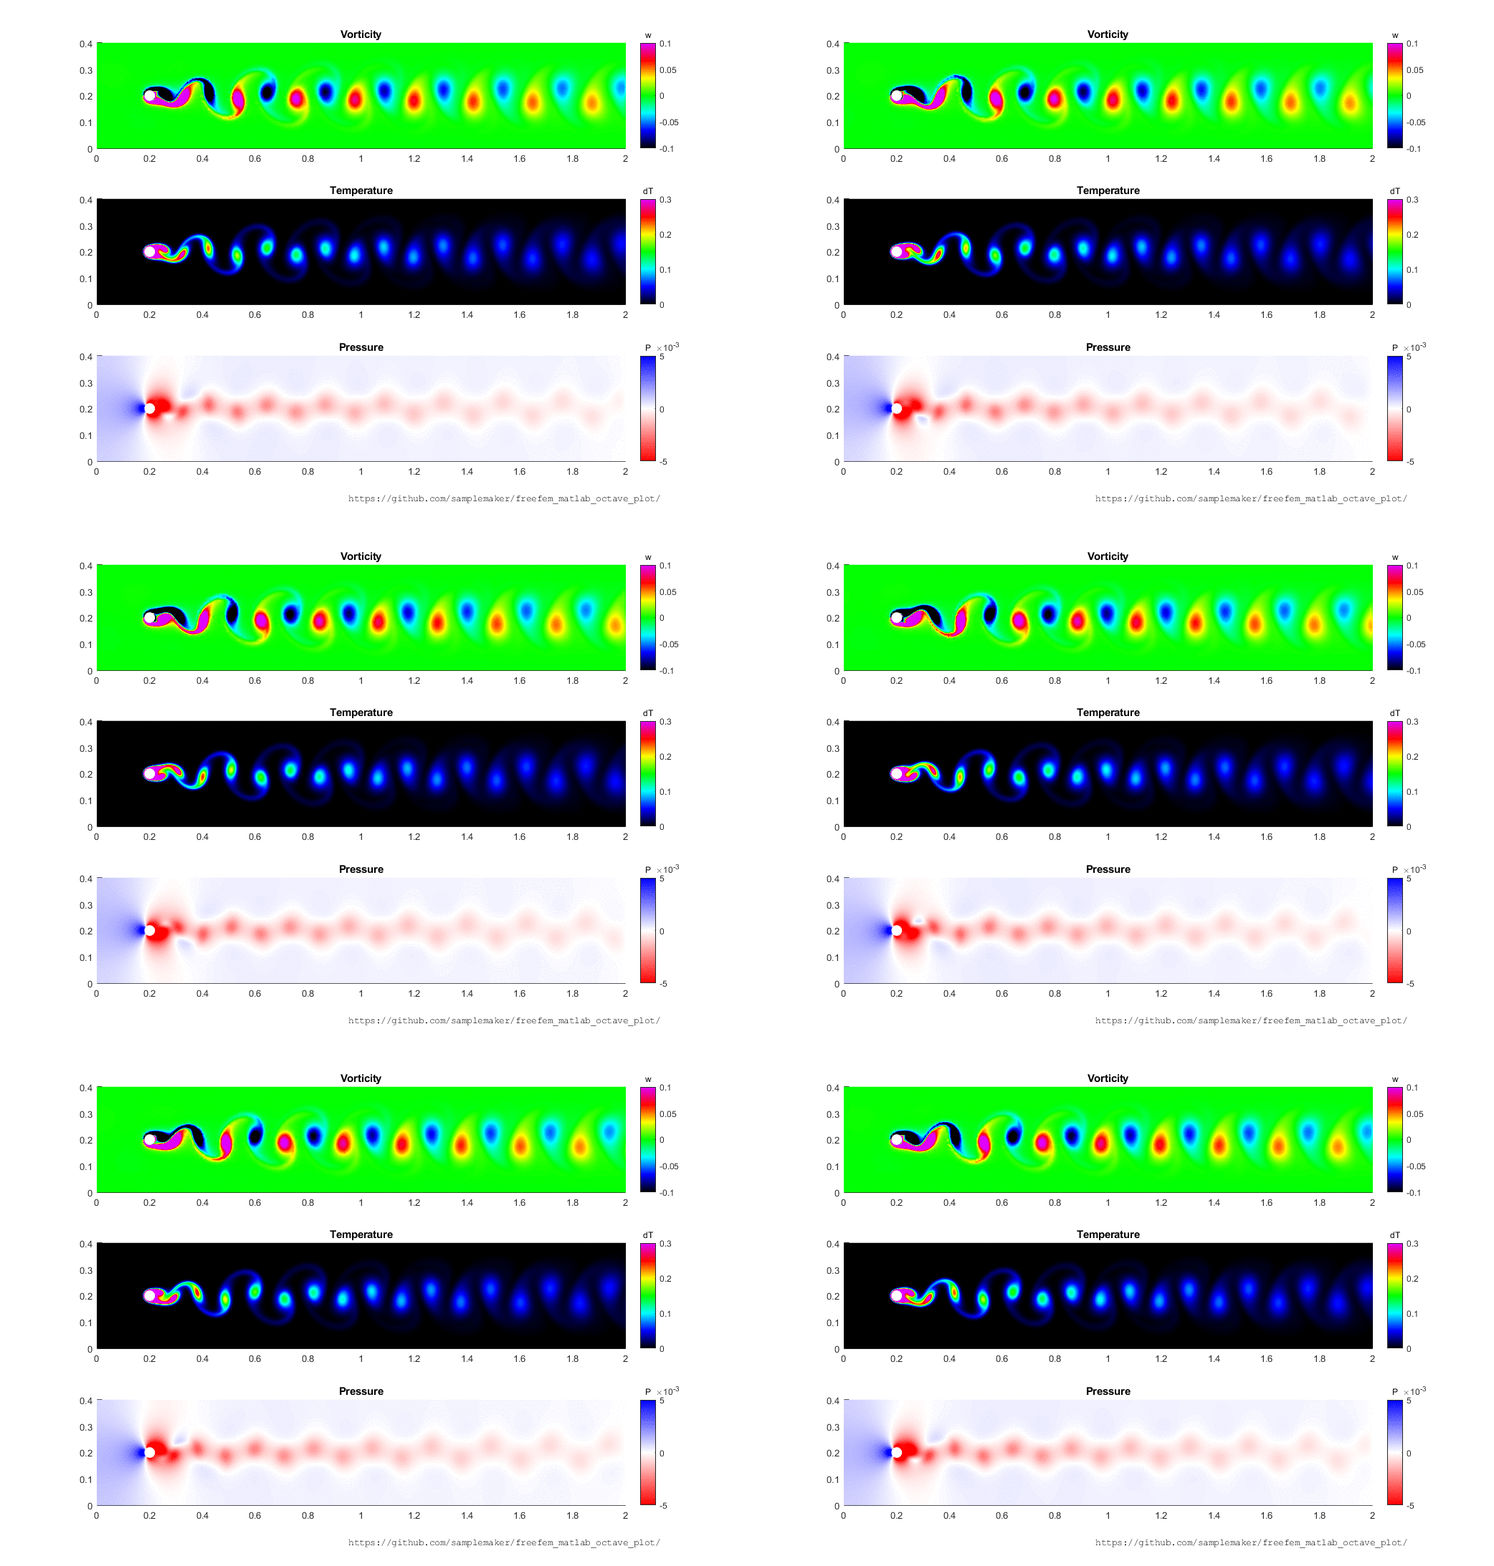
Vortex shedding visualisation CC-BY-SA-4.0 by Thierry Dugnolle
Flow visulisation by R. Gontijo and W. Cerqueira (Fair use)
Vortex street over the Juan Fernández Islands from Landsat 7 - NASA (public domain)

vorticity
Gravity Waves
Waves recap
Simple Harmonic Motion:
- The equation:
\[\begin{equation} \frac{\partial^2 u}{\partial t^2} = - \omega^2 u \end{equation}\]
permits solutions:
\[\begin{equation} u = u_0 e^{i \omega t} \end{equation}\]
i.e. oscillations at frequency \(\omega\).


Wave equation:
- The equation:
\[\begin{equation} \frac{\partial^2 u}{\partial t^2} = c^2 \nabla^2 u \end{equation}\]
permits solutions:
\[\begin{equation} u = u_0 e^{i (\vec{k} \cdot \vec{x} - \omega t)} \end{equation}\]
i.e. oscillations of frequency \(\omega\) travelling in direction \(\vec{k}\).

Pendulum by Wikinana38 used under CC BY-SA 4.0
Mass-spring system by Oleg Alexandrov in public domain
Travelling plane wave by Pajs in public domain
The atmosphere
- Density varies quite slowly
with altitude. - Monotonically decreasing with
altitude
Atmospheric profiles by cmglee used under CC BY-SA 3.0
Gravity Waves: Simple example
Gravity is the restoring force.
Consider a small parcel of air, density \(\rho_0\) displaced by \(\Delta z\) 1.
N2L (\(\, f = \rho_0 \, a\)) gives:
\[\begin{equation} -g \Delta \rho = -g[\rho(z)-\rho(z+\Delta z)] = \rho_0 \frac{\partial^2 \Delta z}{\partial t^2} \end{equation}\]
Linearising in a slowly varying atmosphere s.t. \([\rho(z)-\rho(z+\Delta z)] = -\frac{\partial \rho(z)}{\partial z} \Delta z\):
\[\begin{equation} \frac{\partial^2 \Delta z}{\partial t^2} = \frac{g}{\rho_0} \frac{\partial \rho(z)}{\partial z} \Delta z \,\,\,\,\,\,\,\,\,\, , \,\,\,\,\,\,\,\,\,\, \omega^2 = N^2 = - \frac{g}{\rho_0} \frac{\partial \rho(z)}{\partial z} \end{equation}\]
This is an equation for SHM with the buoyancy force (gravity) causing the parcel to oscillate about the point of neutral density with Brunt–Väisälä frequency \(N\).
Atmospheric internal gravity waves
Skipping over a bunch of maths (see Vallis (2017)) in the atmosphere we get1:
\[\begin{equation} \frac{\partial^2}{\partial t^2}(\nabla^2 + \frac{\partial^2}{\partial z^2}) \vec{u} = -N^2\nabla^2 \vec{u} \end{equation}\]
which is a ‘wave-like’ equation with solutions:
\[\begin{equation} \vec{u} = \vec{u}_0 e^{i (\vec{k} \cdot \vec{x} - \omega t)} \end{equation}\]
where2:
\[\begin{equation} \omega^2 = \frac{\vec{k}^2_\perp N^2}{\vec{k}^2} \end{equation}\]
Solution properties
From the maths we can deduce1:
\(N^2 > 0\) required for stability
(i.e. stratification of \(\mathrm{d}\rho/\mathrm{d}z < 0\))\(\vec{u} \cdot \vec{c}_p \sim \vec{u} \cdot \vec{k} = 0\)
⇒ Fluid (air, water) motion is parallel to wavefronts\(|{\vec{u}|} \sim N^{-1}\)
⇒ amplitude grows as waves propogate higher- Nonlinear effects enter
- Waves can break
\[\begin{equation} \frac{\partial^2}{\partial t^2}(\nabla^2 + \frac{\partial^2}{\partial z^2}) \vec{u} = -N^2\nabla^2 \vec{u} \end{equation}\]
\[\begin{equation} \vec{u} = \vec{u}_0 e^{i (\vec{k} \cdot \vec{x} - \omega t)} \end{equation}\]
\[\begin{equation} \omega^2 = \frac{\vec{k}^2_\perp N^2}{\vec{k}^2} \end{equation}\]
Solution properties - Energy
From the maths we can deduce1:
- \(\vec{k} \cdot \vec{c}_g = 0\)
⇒ Energy propogates perpendicular to the waves! - In a mean flow \(\vec{c}_g\) can be reduced to zero
- allows significant dissipation and energy dissipation from wave
- can deposit momentum to the flow which is key for the QBO2
\[\begin{equation} \frac{\partial^2}{\partial t^2}(\nabla^2 + \frac{\partial^2}{\partial z^2}) \vec{u} = -N^2\nabla^2 \vec{u} \end{equation}\]
\[\begin{equation} \vec{u} = \vec{u}_0 e^{i (\vec{k} \cdot \vec{x} - \omega t)} \end{equation}\]
\[\begin{equation} \omega^2 = \frac{\vec{k}^2_\perp N^2}{\vec{k}^2} \end{equation}\]
Wave properties
Generation:
- Topography
- Frontal systems (collision of air masses of different density)
Results:
- Key source of momentum transfer in the atmosphere
- Important in driving
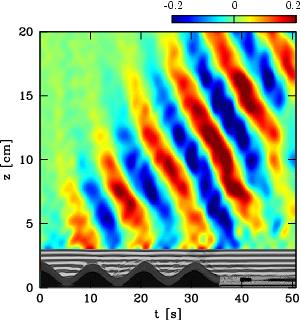
Gravity Waves generated by topography by Bruce Sutherland.
asdf

Gravity Waves over Amsterdam Island by NASA (public domain).
Other notes
- These same dynamics can also exist in the ocean
- an ‘upside-down atmosphere’ (more on this later)
Sources
Heavily based on Vallis (2017)
See also Davidson (2013)
Wayne Hocking has some excellent notes with nice diagrams illustrating some of the more complex features.
The Quasi-Biennial Oscillation (QBO)
The QBO
A nearly periodic reversal of the zonal wind in the equatorial stratosphere.
The QBO
A nearly periodic reversal of the zonal wind in the equatorial stratosphere.
- The second region of the atmosphere1
- Tropopause -> Stratopause
- ~10-15 km -> 50 km
- 200 - 1 hPa
Aside - pressure as a height coordinate
\(z\) (m) is a natural choice for a vertical coordinate.
However, we could use anything that has a 1:1 mapping to z. Pressure is one such value1:
\[\begin{equation} \frac{\mathrm{d}p}{\mathrm{d}z} = -\rho(z) g \end{equation}\]
usually represented in hPa (hectoPascals)2
The advantage of using pressure is that it simplifies some equations, and is directly linked to observations.
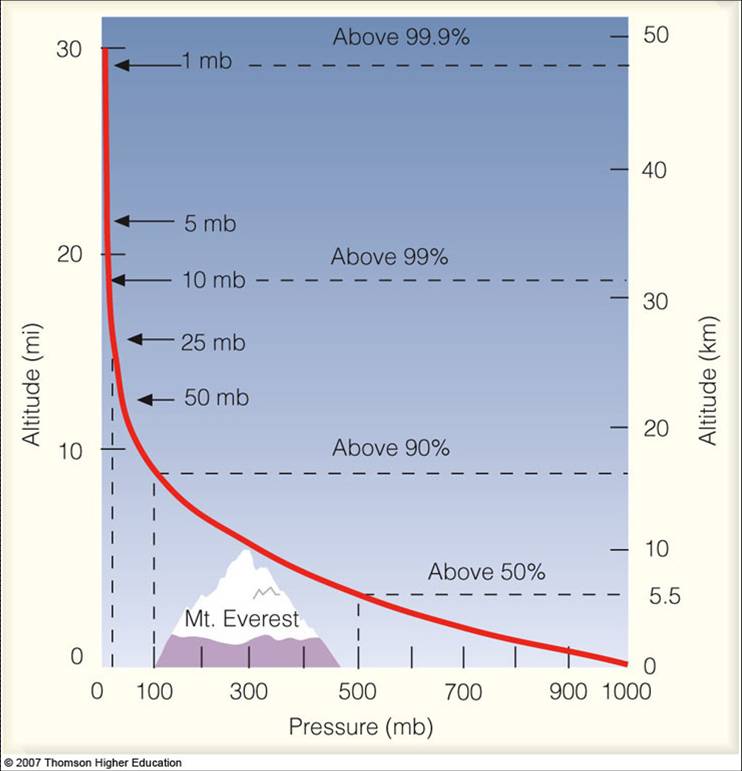
Atmospheric pressure profile from North Carolina State University used under fair use
The QBO
A nearly periodic reversal of the zonal wind in the equatorial stratosphere.
- 5 - 100 hPa (40-80 km)
The QBO
A nearly periodic reversal of the zonal wind in the equatorial stratosphere.
- Quasi-biennial => “Almost every 2 years”
period of 28 months (22-34) - 5 - 100 hPa (40-80 km)
The QBO
A nearly periodic reversal of the zonal wind in the equatorial stratosphere.
- Quasi-biennial => “Almost every 2 years”
period of 28 months (22-34) - Zonal = following lines of latitude (E-W)
Meridional = following lines of longitude (N-S) - The stratosphere is dominated by zonal jets (~ 30 m/s)
see Zonal Winds at 10 hPa - Earth.nullschool - 5 - 100 hPa (40-80 km)
The QBO
A nearly periodic reversal of the zonal wind in the equatorial stratosphere.
- Quasi-biennial => “Almost every 2 years”
period of 28 months (22-34) - Zonal = following lines of latitude (E-W)
Meridional = following lines of longitude (N-S) - The stratosphere is dominated by zonal jets (~ 30 m/s)
see Zonal Winds at 10 hPa - Earth.nullschool - +/- 12 deg about equator
- 5 - 100 hPa (40-80 km)
The QBO
A nearly periodic reversal of the zonal wind in the equatorial stratosphere.
- Quasi-biennial => “Almost every 2 years”
period of 28 months (22-34) - Pattern descends at 1 km per month
- Zonal = following lines of latitude (E-W)
Meridional = following lines of longitude (N-S) - The stratosphere is dominated by zonal jets (~ 30 m/s)
see Zonal Winds at 10 hPa - Earth.nullschool - +/- 12 deg about equator
- 5 - 100 hPa (40-80 km)
The QBO
Time–height plot of monthly-mean, zonal-mean equatorial zonal wind (u) in m/s between about 20 and 35 km (22 mi) altitude above sea level over a ten-year period. Positive values denote westerly winds and the contour line is at 0 m/s. Radiosonde data from FU Berlin.
QBO plot by Pierre cb in the public domain.
The QBO - Mechanism
Recall that when waves exist in a mean flow if u = c_p then vertical group velocity is zero
mean flow acts to slow upwards propogation of GW and they deposit energy.
Model based on upward propogation on GW and the effect on zonal flow. Holton and Lindzden (1968)
Waves generated in upper equatorial troposphere. deep convection etc.
As they propogate upwards eventually cp = u_bar => wave slows giving more time for dissipation to act.
Dissipation deposits energy, increasing mean flow u_bar. This causes the point at which waves slow to be lower in atmosphere, causing dissipation in a cycle etc etc.
This does not explain reversal, however -> 2 wave model
wave that matches mean flow will be dissipated, whilst the other will propogate higher. dissipation low accelerates the flow, causing wind to ‘descend’ other wave dissipating higher will ‘accellerate’ the ‘slower’ flow in the opposite direction Leading to a higher reversal and dissipation.
The QBO - Importance
- affects the jet stream
- Easterly => weakens jet stream
cold winters in N Europe/E US more likely - Westerly => Strengthens jet stream
mild winters, storms and rainfall more likely
- Easterly => weakens jet stream
Sources
Heavily based on Vallis (2017)
See also Davidson (2013)
Wayne Hocking has some excellent notes with nice diagrams illustrating some of the more complex features.
Ocean Primers
Sea Surface Temperature
- The marine variable with the largest effect on the global climate.
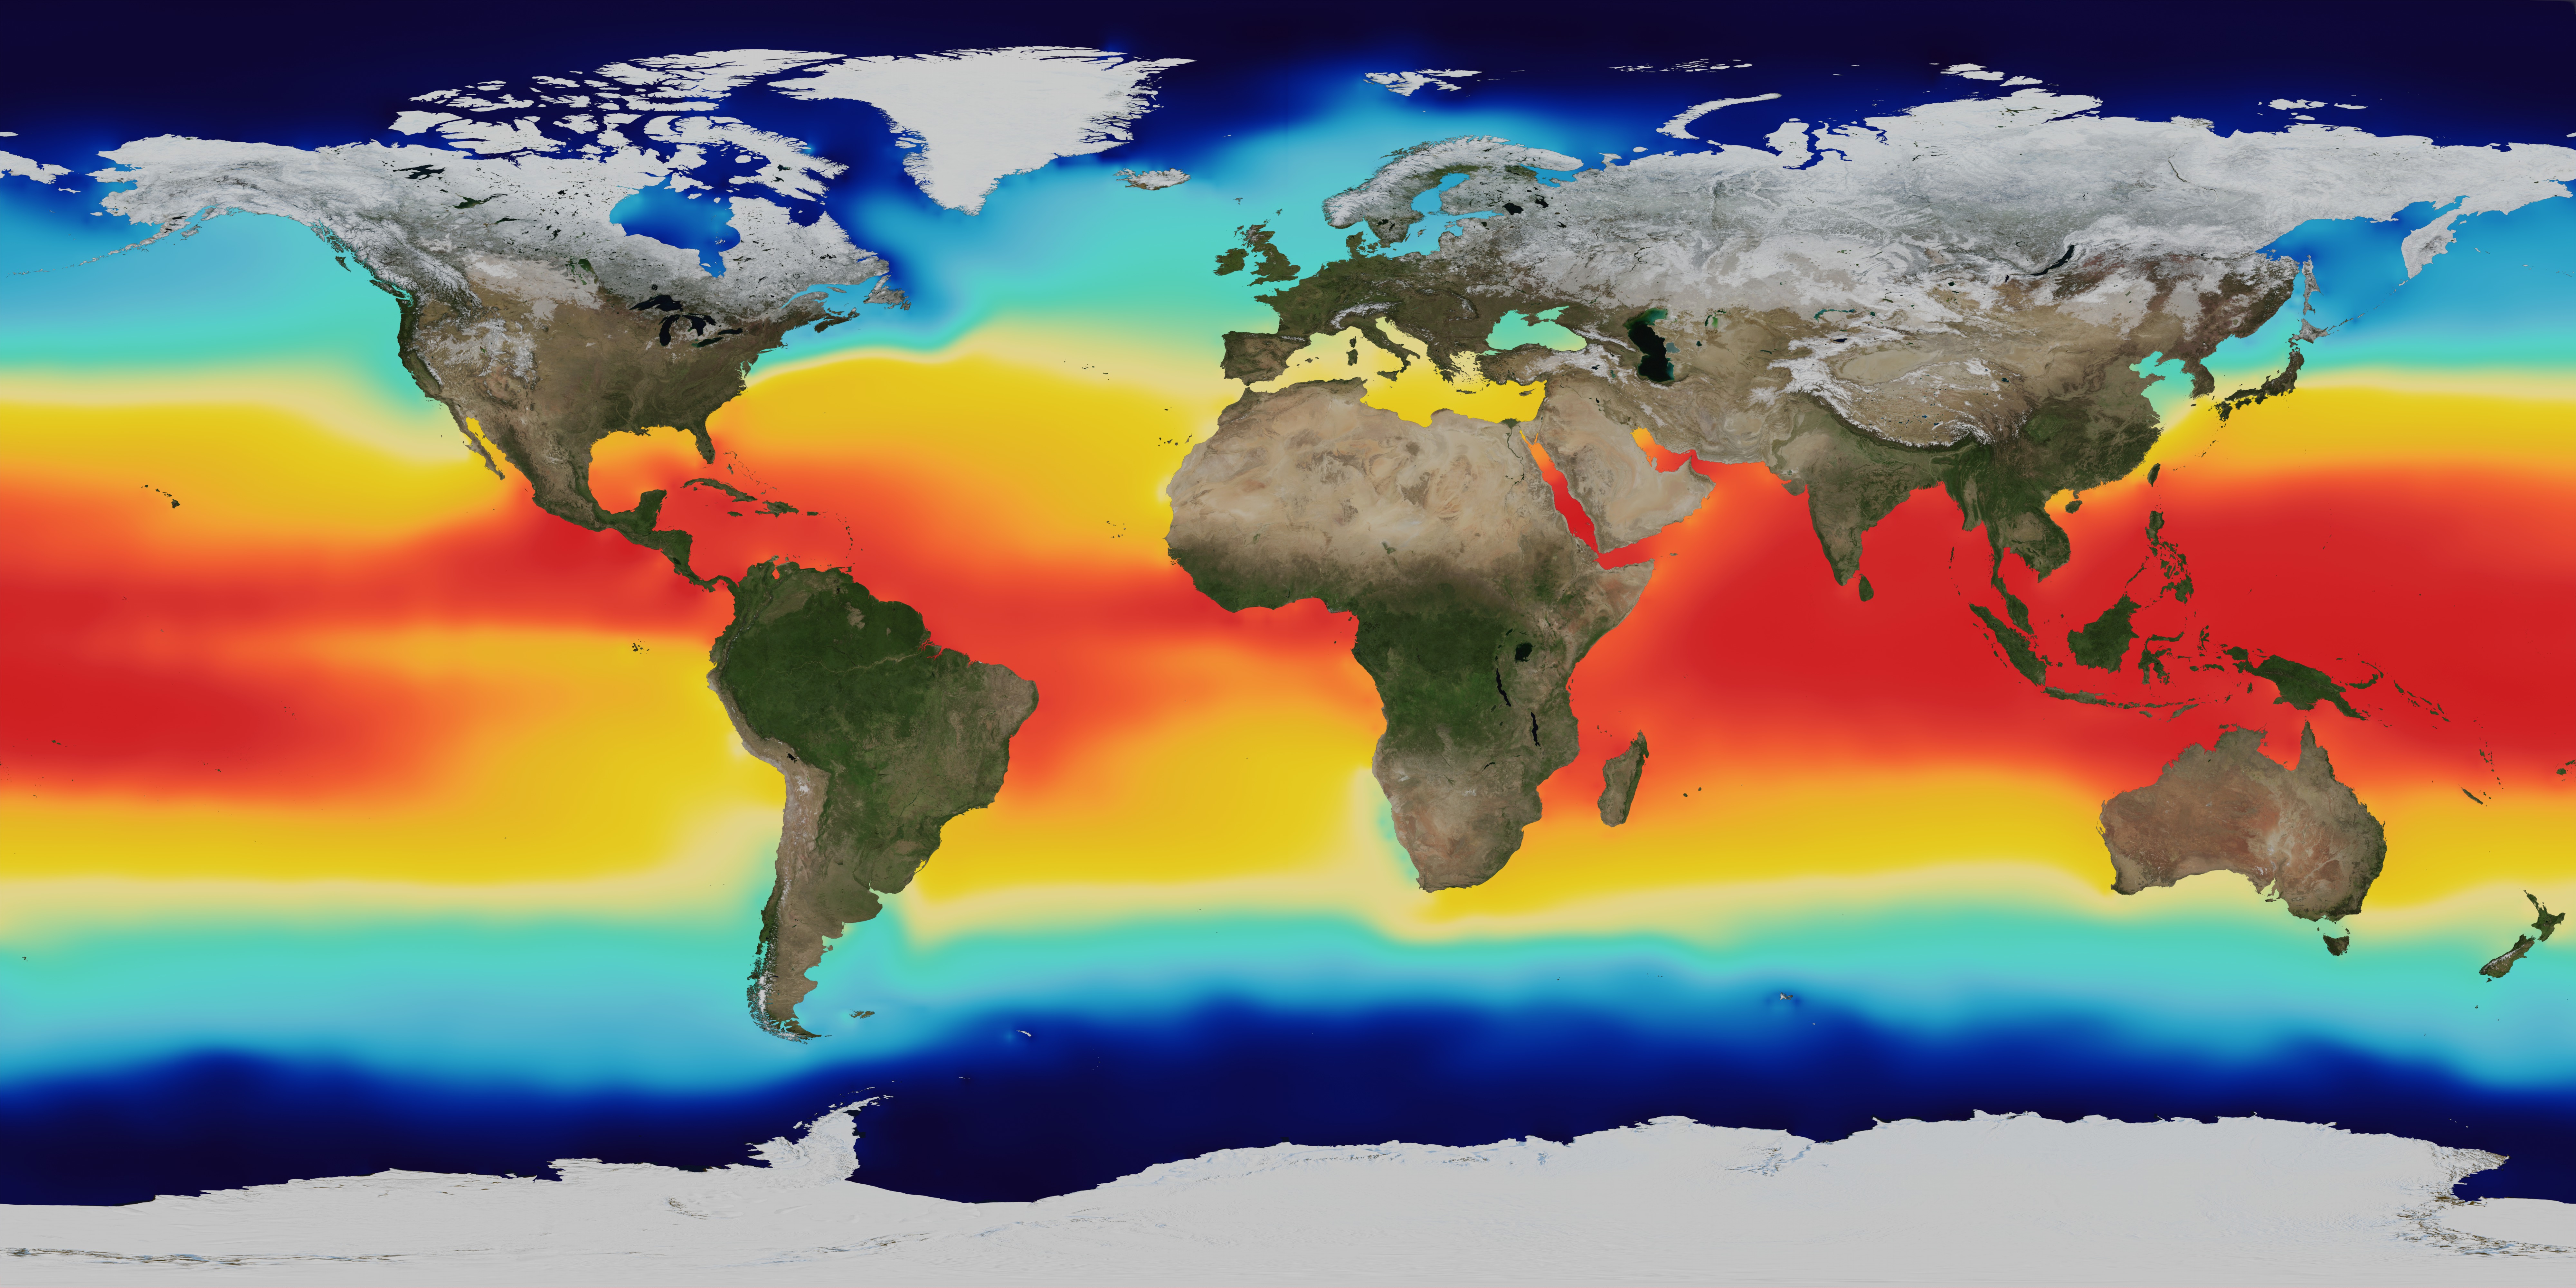
Image by NASA (public domain)
Ocean Gyres
Global Ocean Currents

Image by NOAA (public domain)
Global Ocean Currents
- Primarily wind-driven
- Topography and geography is important
- Large-scale basin structures
- Westward equatorial currents
- Results in Gulf Stream, Kuroshio, and Brazil Current

Image by NOAA (public domain)
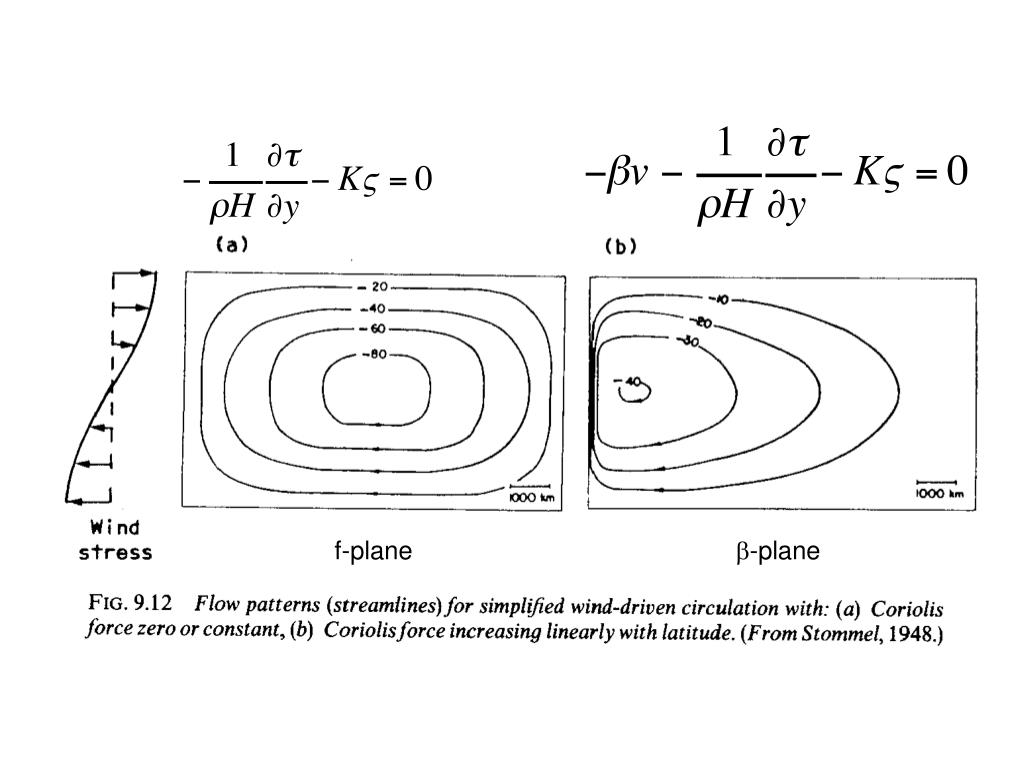
The Stommel Model
- Assume the ocean surface and bed are flat.
- Integrate horizontal motion over the ocean depth.
- Average horizontal velocity depends only on Top and Bottom stresses and Coriolis.
- Top stress provided by wind
- Given stress and latitude we can define the 2D horizontal flow
- Sometimes known as ‘Sverdrup flows’.
The Meridional Overturning Circulation (MOC)
Vertical Structure of the Ocean
The Stommel model and Sverdrup flows tell us about the vertically integrated flow.
In reality we also need to understand the vertical variations.
ENSO
ENSO
- One of the most visible examples of how the atmosphere and ocean are coupled
- Occurs in the tropics (±5º lat)
- Aperiodic oscillation of 2-5 years
El Niño
- A rise in sea surface temperature in the eastern tropical Pacific
- 0.5 - 6ºC substained over several months
The Southern Oscillation
- A weakening of the trade winds over the Pacific
- Precipitation moves Eastward
Visually
- Recall the Sverdrup flows/ocean gyres - water around the Peruvian coast should be cooler.
- During ENSO we see an anomaly with higher temperatures in the east and lower in the west.
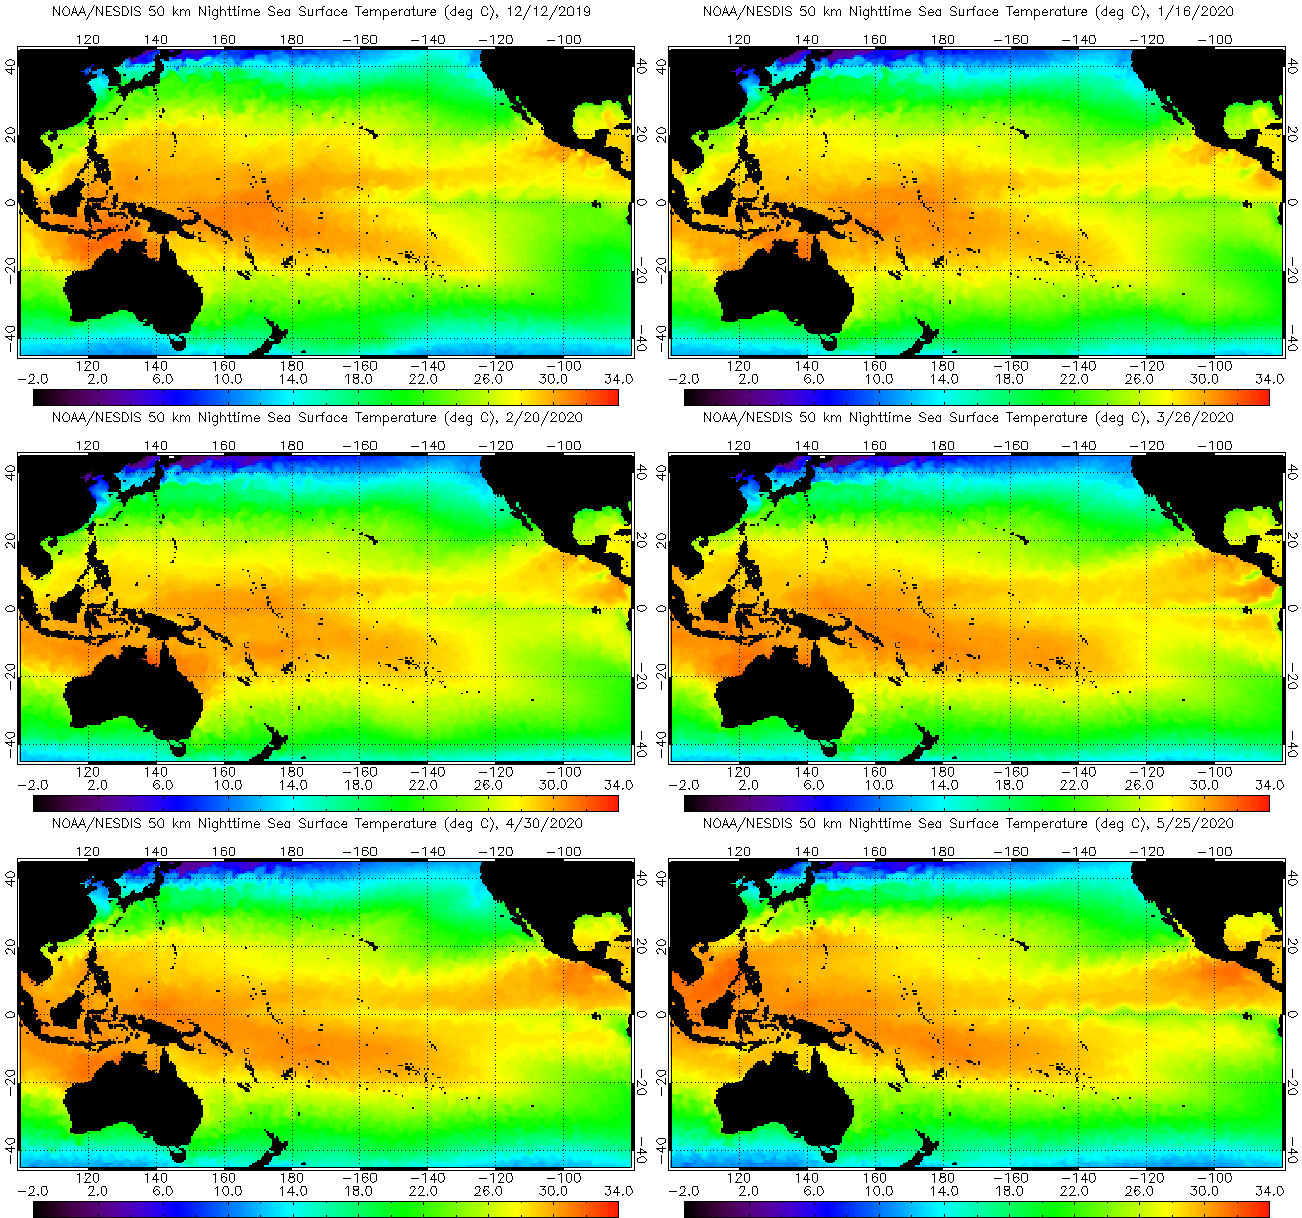
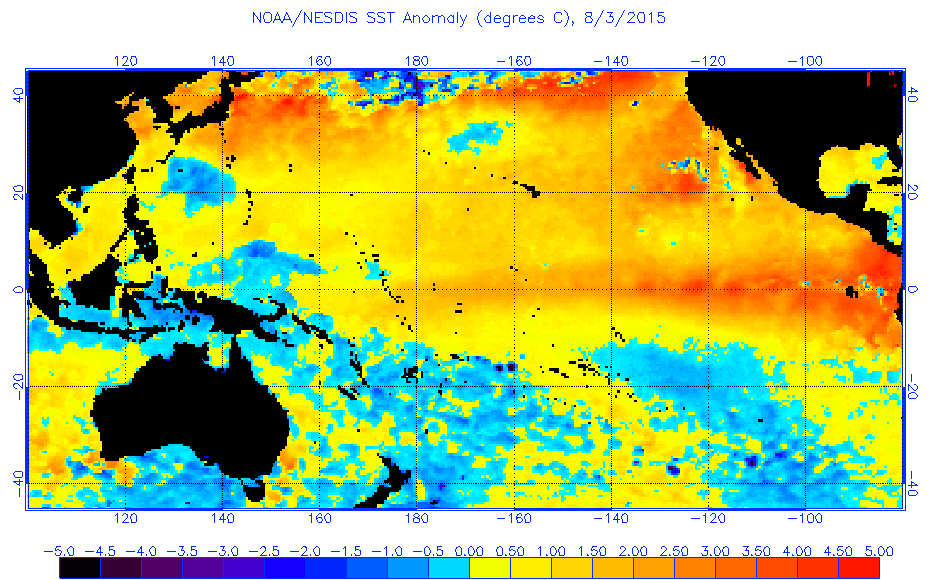
SST from NOAA (public domain)
Why?
- SST increases as waters move from east to west, driven by trade winds.
- Gradient in SST sets up a Walker Cell in the atmosphere.
- Each of these reinforce one another in a positive feedback system.

Animation by BOM Aus. (public domain)
Effects - Teleconnections
- Thermocline drops - nutrient upwelling is reduced
- Jet stream strengthened over E. Pacific and US
High pressure in Canada, Low in Florida - Storms and rainfall in Americas
Drought in Indonesia and Australia - Higher than usual global temperatures
Aperiodicity
A question of different timescales:
- Trade winds operate on an annual cycle
- Thermocline changes communicated by waves that cross the Pacific basin in 70-200 days.
References
Contact
These slides at:
https://jack.atkinson.net/slides/queens_pdra.html
I can be reached at:
References
